How it works
GhostVision is an advanced indicator, Made with combined 20 years of trading experience. It took two people 3 years of hard work by coding, fine-tuning and live trading it. The result is a simple way to understand the technical analysis of the market conditions for Bitcoin or other non-cryptocurrency markets. Be a more profitable trader by avoiding common mistakes, know what to do and when and you can use it for all trading styles (intraday, day trading, or swing trading).
Ghost Vision I
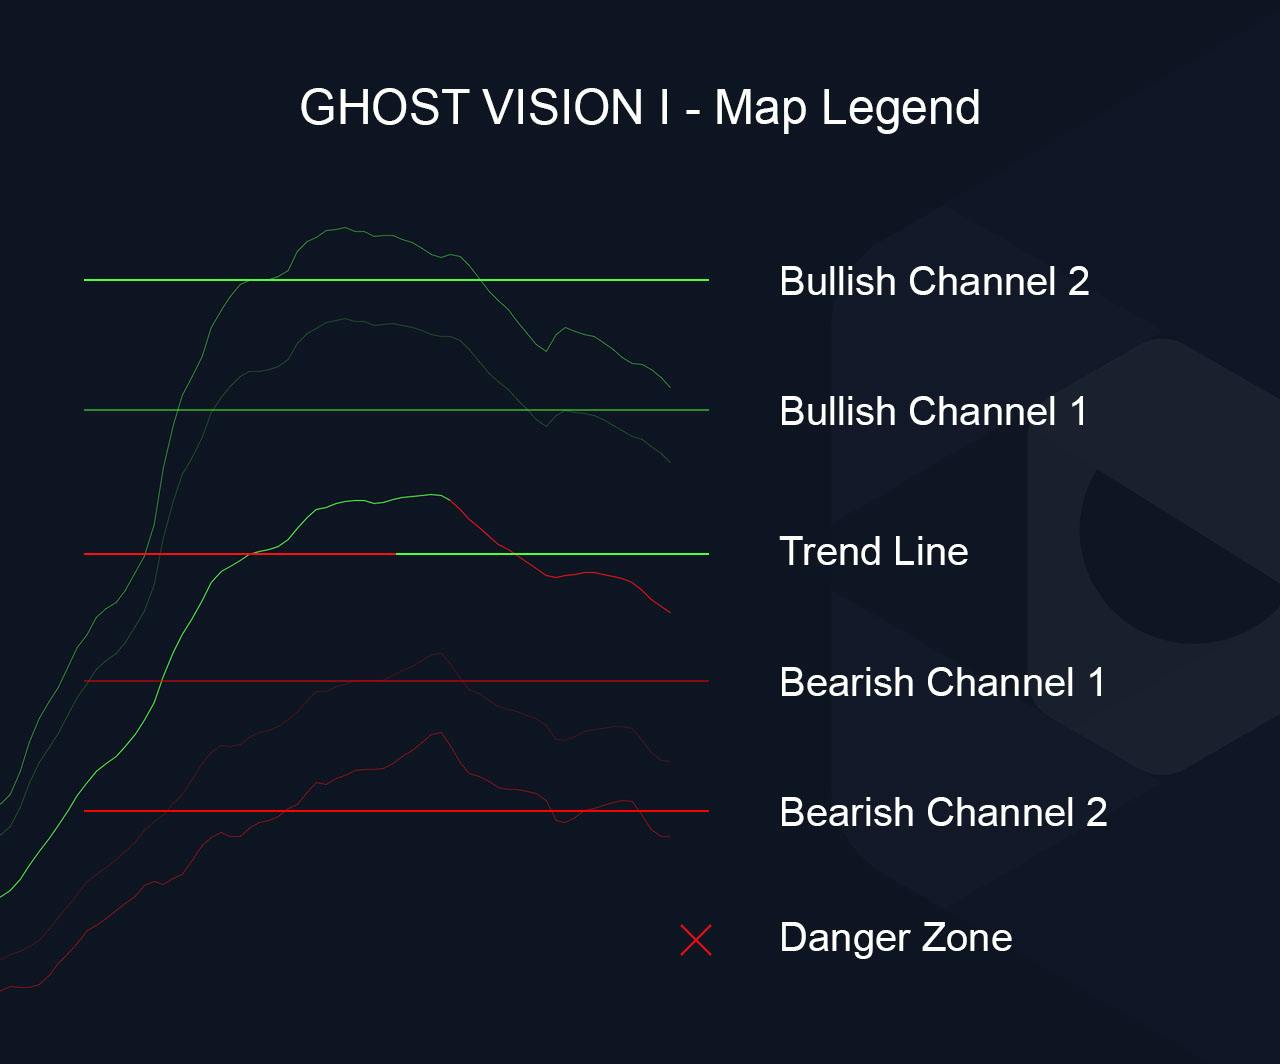
Channels indicate the extreme of the price movement compared to normal movement, a middle line indicates the current trend direction — green for bullish and red for bearish. Divergences with price are displayed with H — for hidden, and R-for regular likewise green or red for bullish or bearish.
Is that price movement has power behind it or it’s just a divergence?
Is the current price is valued fairly or is it extreme?
Is it a good time to enter a position?
Where should I take profit?
Where should put my stop loss?
Next level of Trading
Ghost Vision II
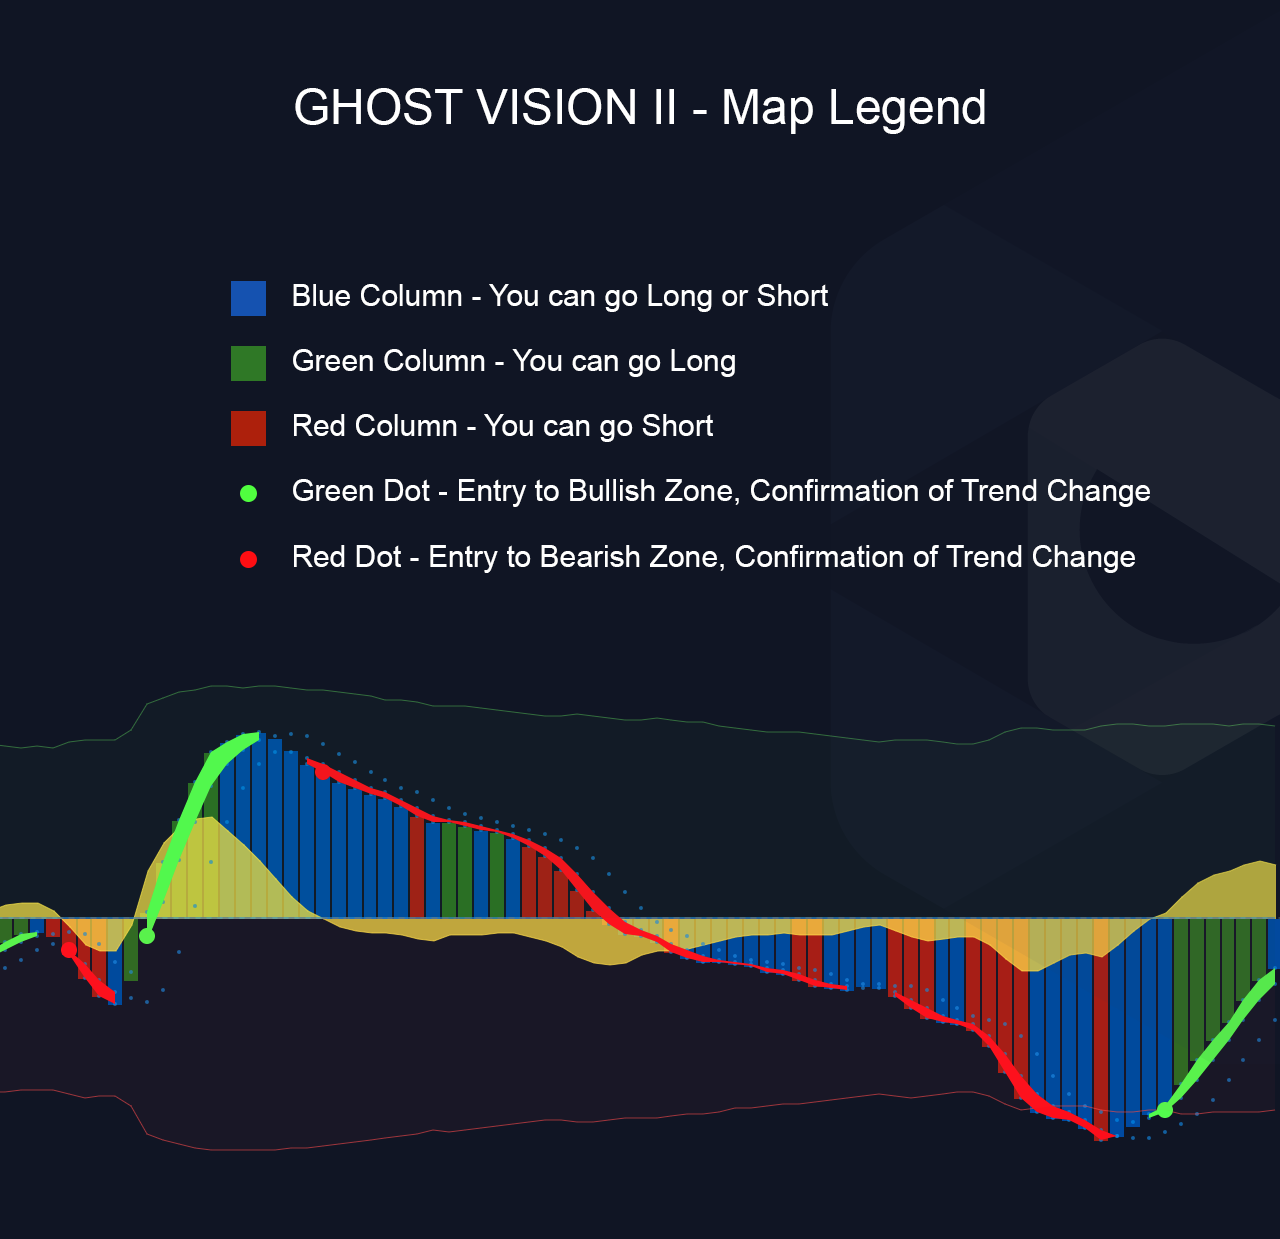
Price action zone — above(green) and below(red) the line is an indication of where the price action is currently at you can also identify the current direction and strength by using the mountains. Column colors provide feedback with three colors blue, green and red. They have an important function in which they tell you what you shouldn’t be doing against momentum and strength.
Should you be looking for long or short opportunities?
What is the direction of the current trend?
How strong is the direction of the current trend?
The current trend in a divergence?
Did the trend direction change or about to?
I’m allowed to go short or long now or wait?
Ghost Vision III
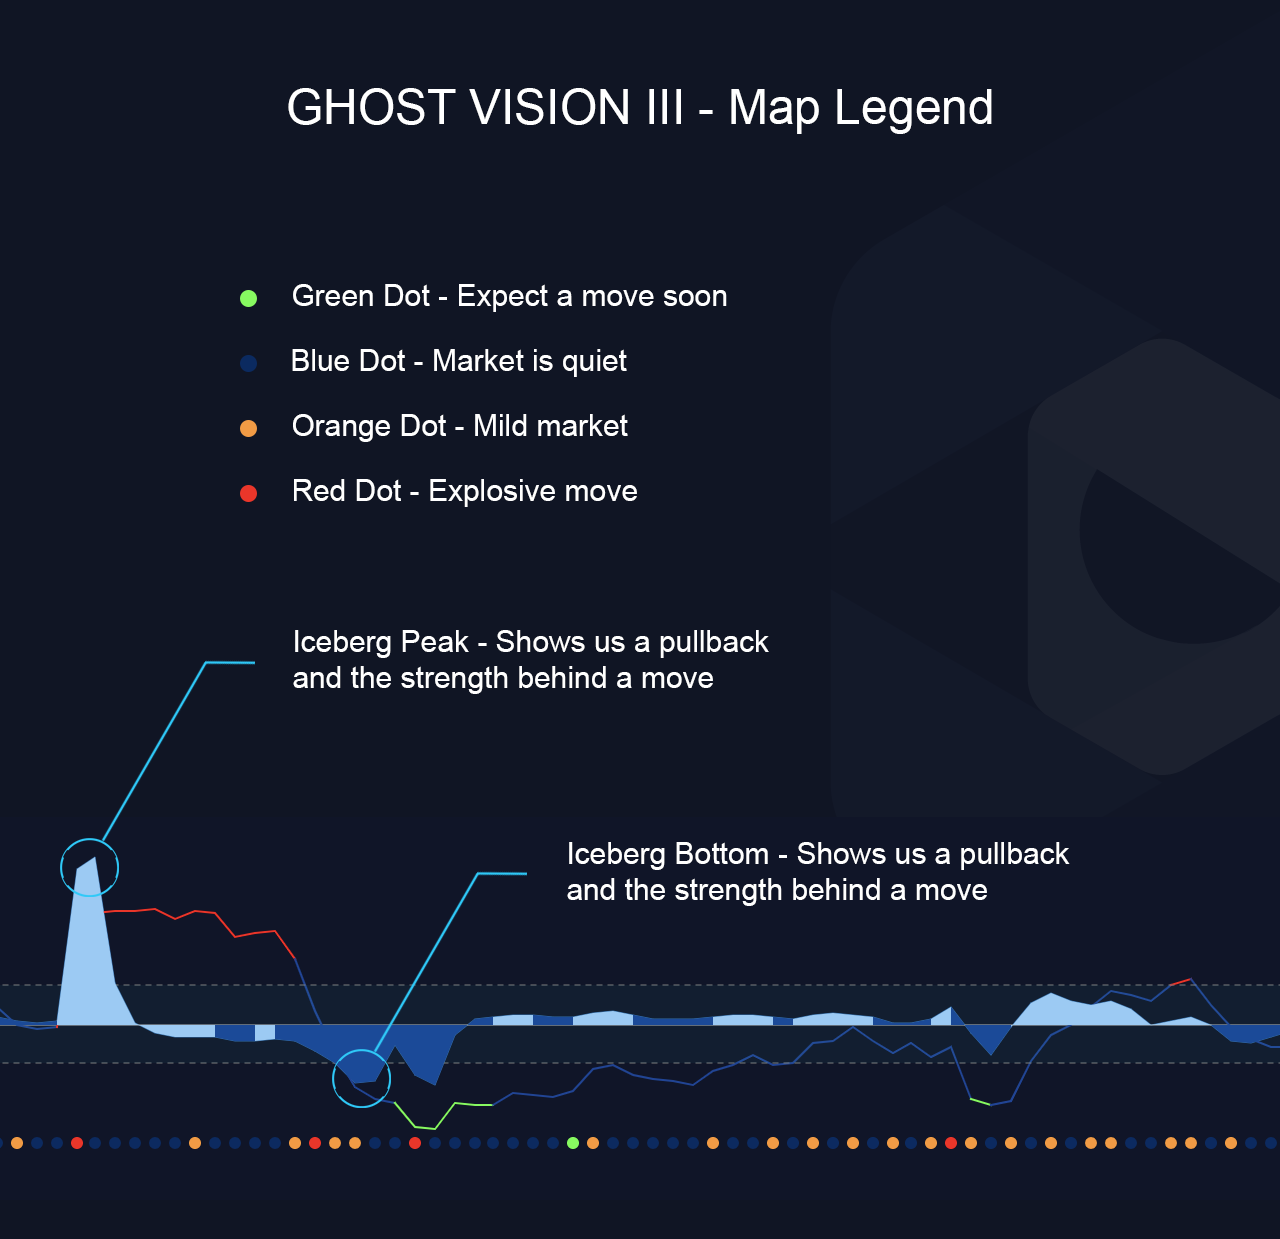
Green, red and blue line can be over or under the baseline indicates oversold or overbought periods, green or red mountains are meant to explain price and volume momentum direction & strength. Dots are for market heat green is for less activity than normal blue for low activity, orange for a medium activity and red for high activity.
Should I take profit now?
The level amount of volume and price action?
Oversold or overbought?
Is it a pullback?
A custom-built indicator
for Day Trading
Ghost Vision IV & V
Ghost Vision IV
The tool that combines multiple oscillators from different time frames into a few lines with visual indicators that show when momentum starts to shift.

Ghost Vision V
Provides multiple exponential moving average (EMA) lines on the main chart from different time frames as boundaries for price action. When the price moves too far outside of these boundaries, you can expect a pullback to the mean, also known as mean reversion.
Get updates & offers
Learn more about us & get exclusive deals.
Copyright © 2023 Ghost Vision Trading | All Rights Reserved