Introducing
Ghost Vision
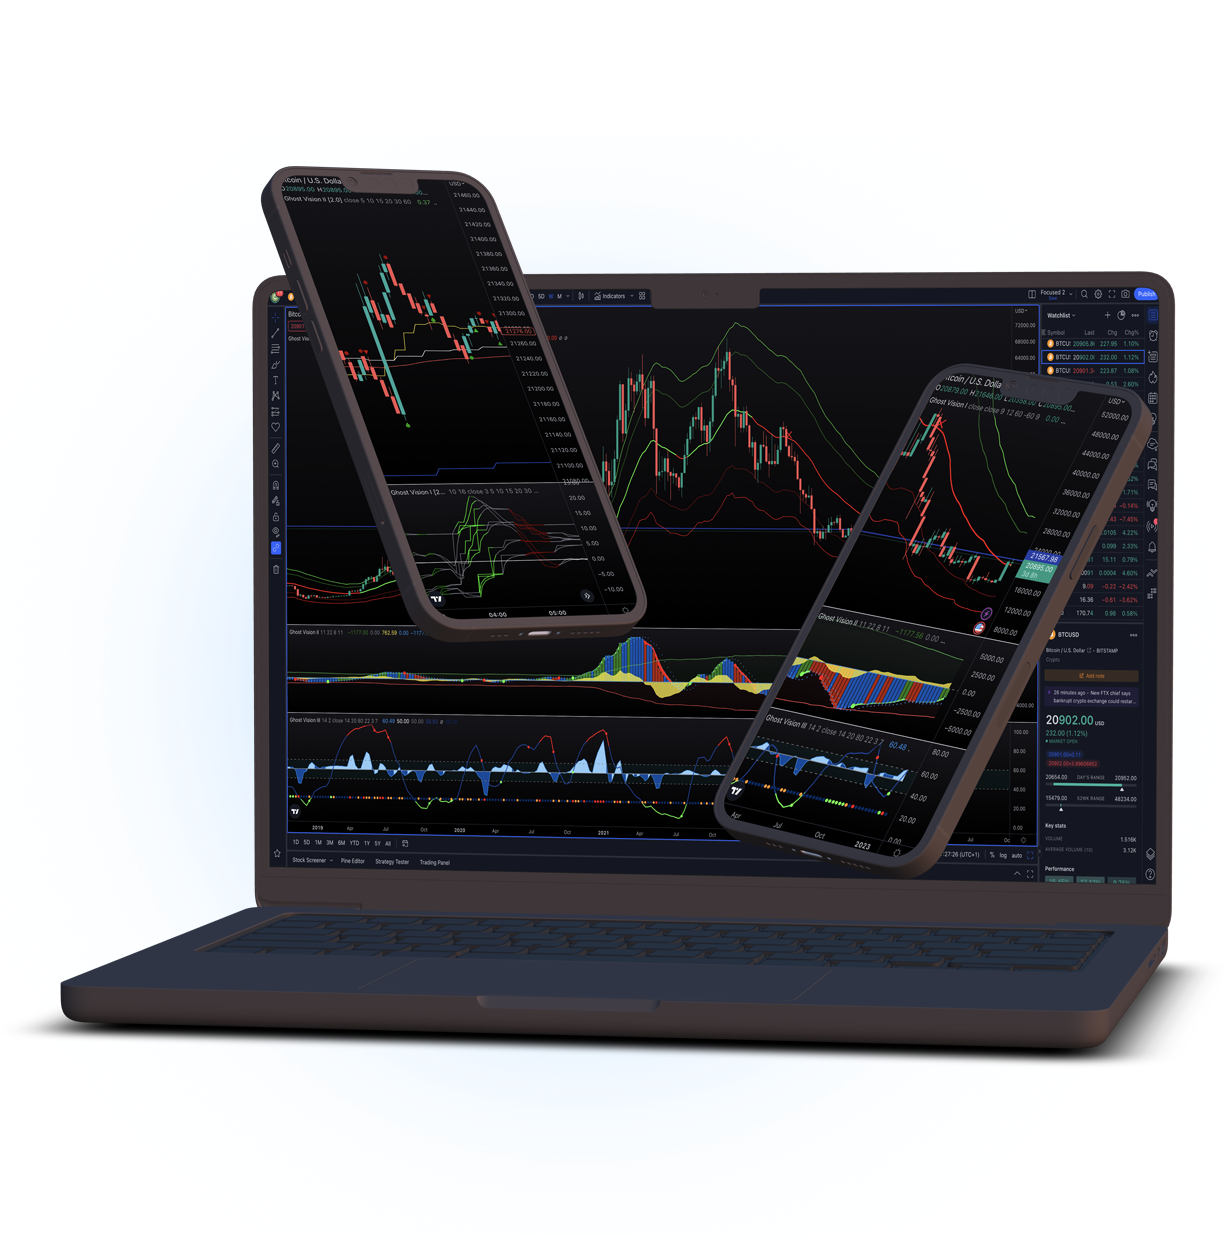
The next generation of Technical Analysis & Trading for everyone. Five innovative indicators that let you analyze the markets. In five more ways. The most powerful and efficient indicators ever in TradingView.
You've never seen Indicators like this before.
Ghost Vision brings power to traders. The tool makes chart analyzing fly - from general trend recognition to exact entry and exit points. It is engineered to help new and pro traders push the boundaries of their ingenuity and creativity. It is engineered to help both new and experienced traders make more informed decisions and improve their trading performance.

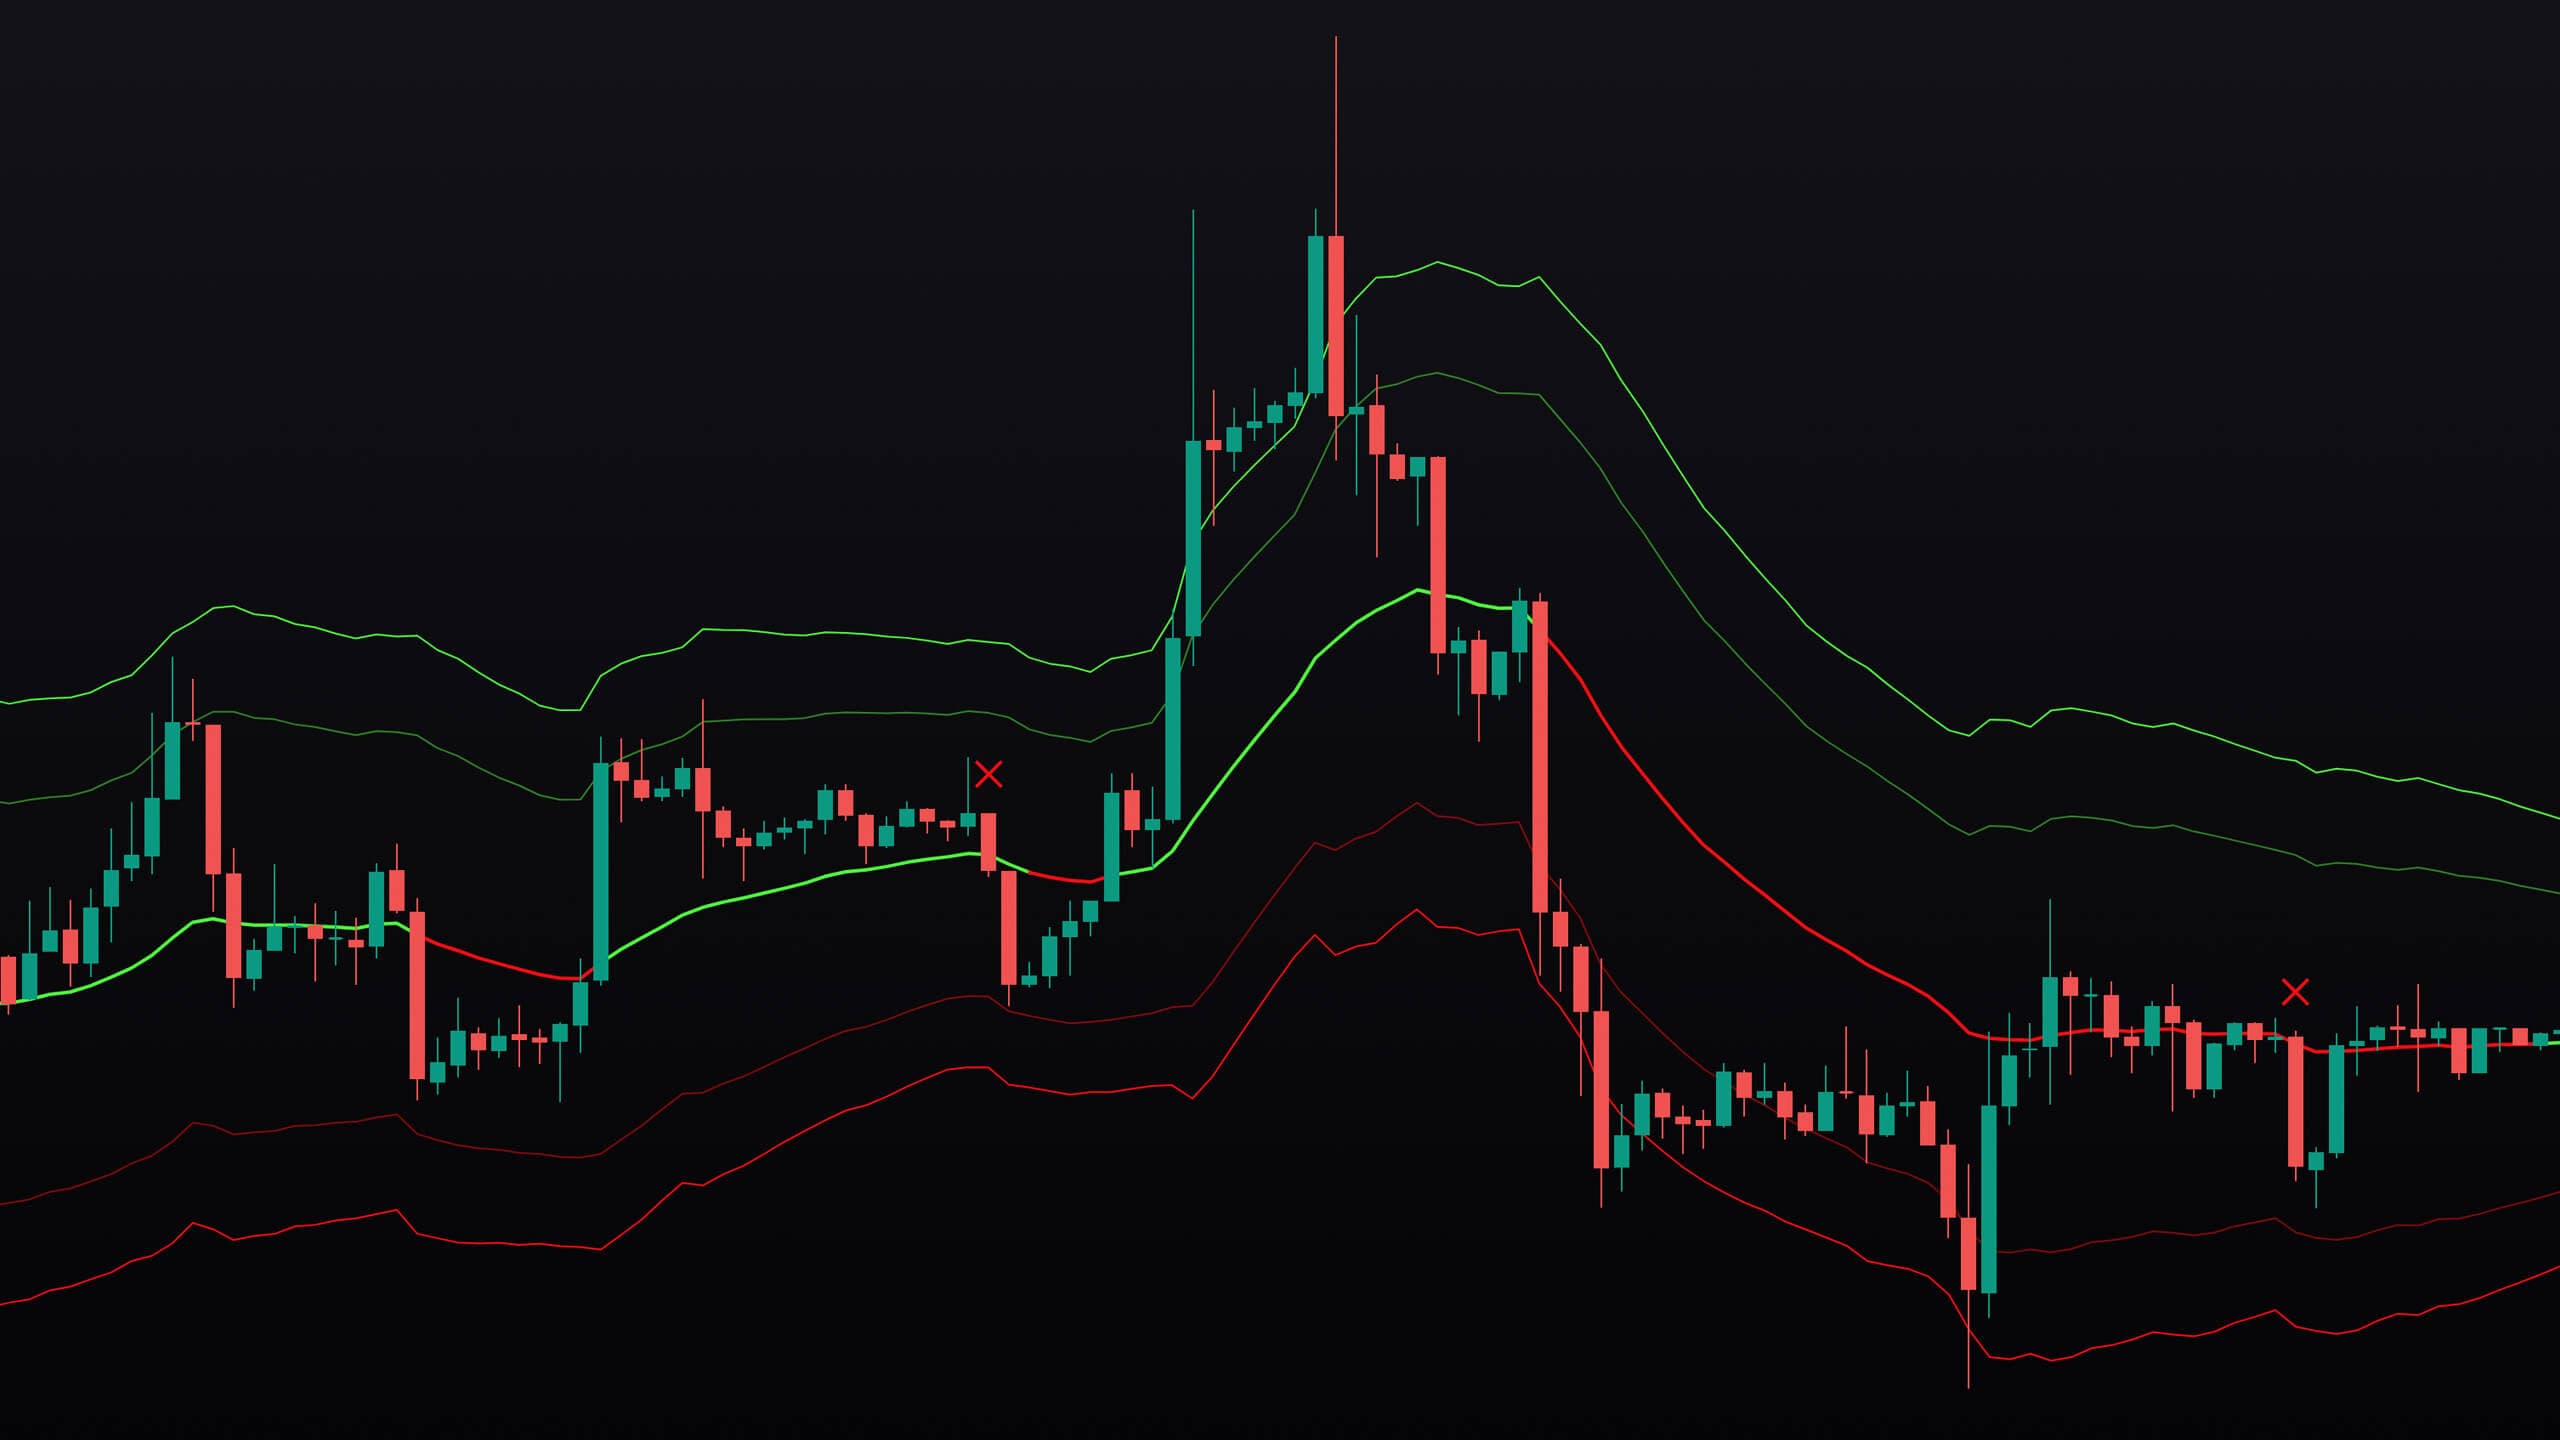
Ghost Vision I, II and III: Best used for Technical Analysis & Swing-Trading

4.7/5, based on 97 reviews
Ghost Vision I, II and III: Best used for Technical Analysis & Swing-Trading
4.7/5, based on 97 reviews
This is our core indicators that we use on daily basis to be aligned with the market. It uses a combination of channels, divergences, price action zones, and color-coded columns. It helps traders make informed decisions on entry and exit points, taking profit, and stop loss.
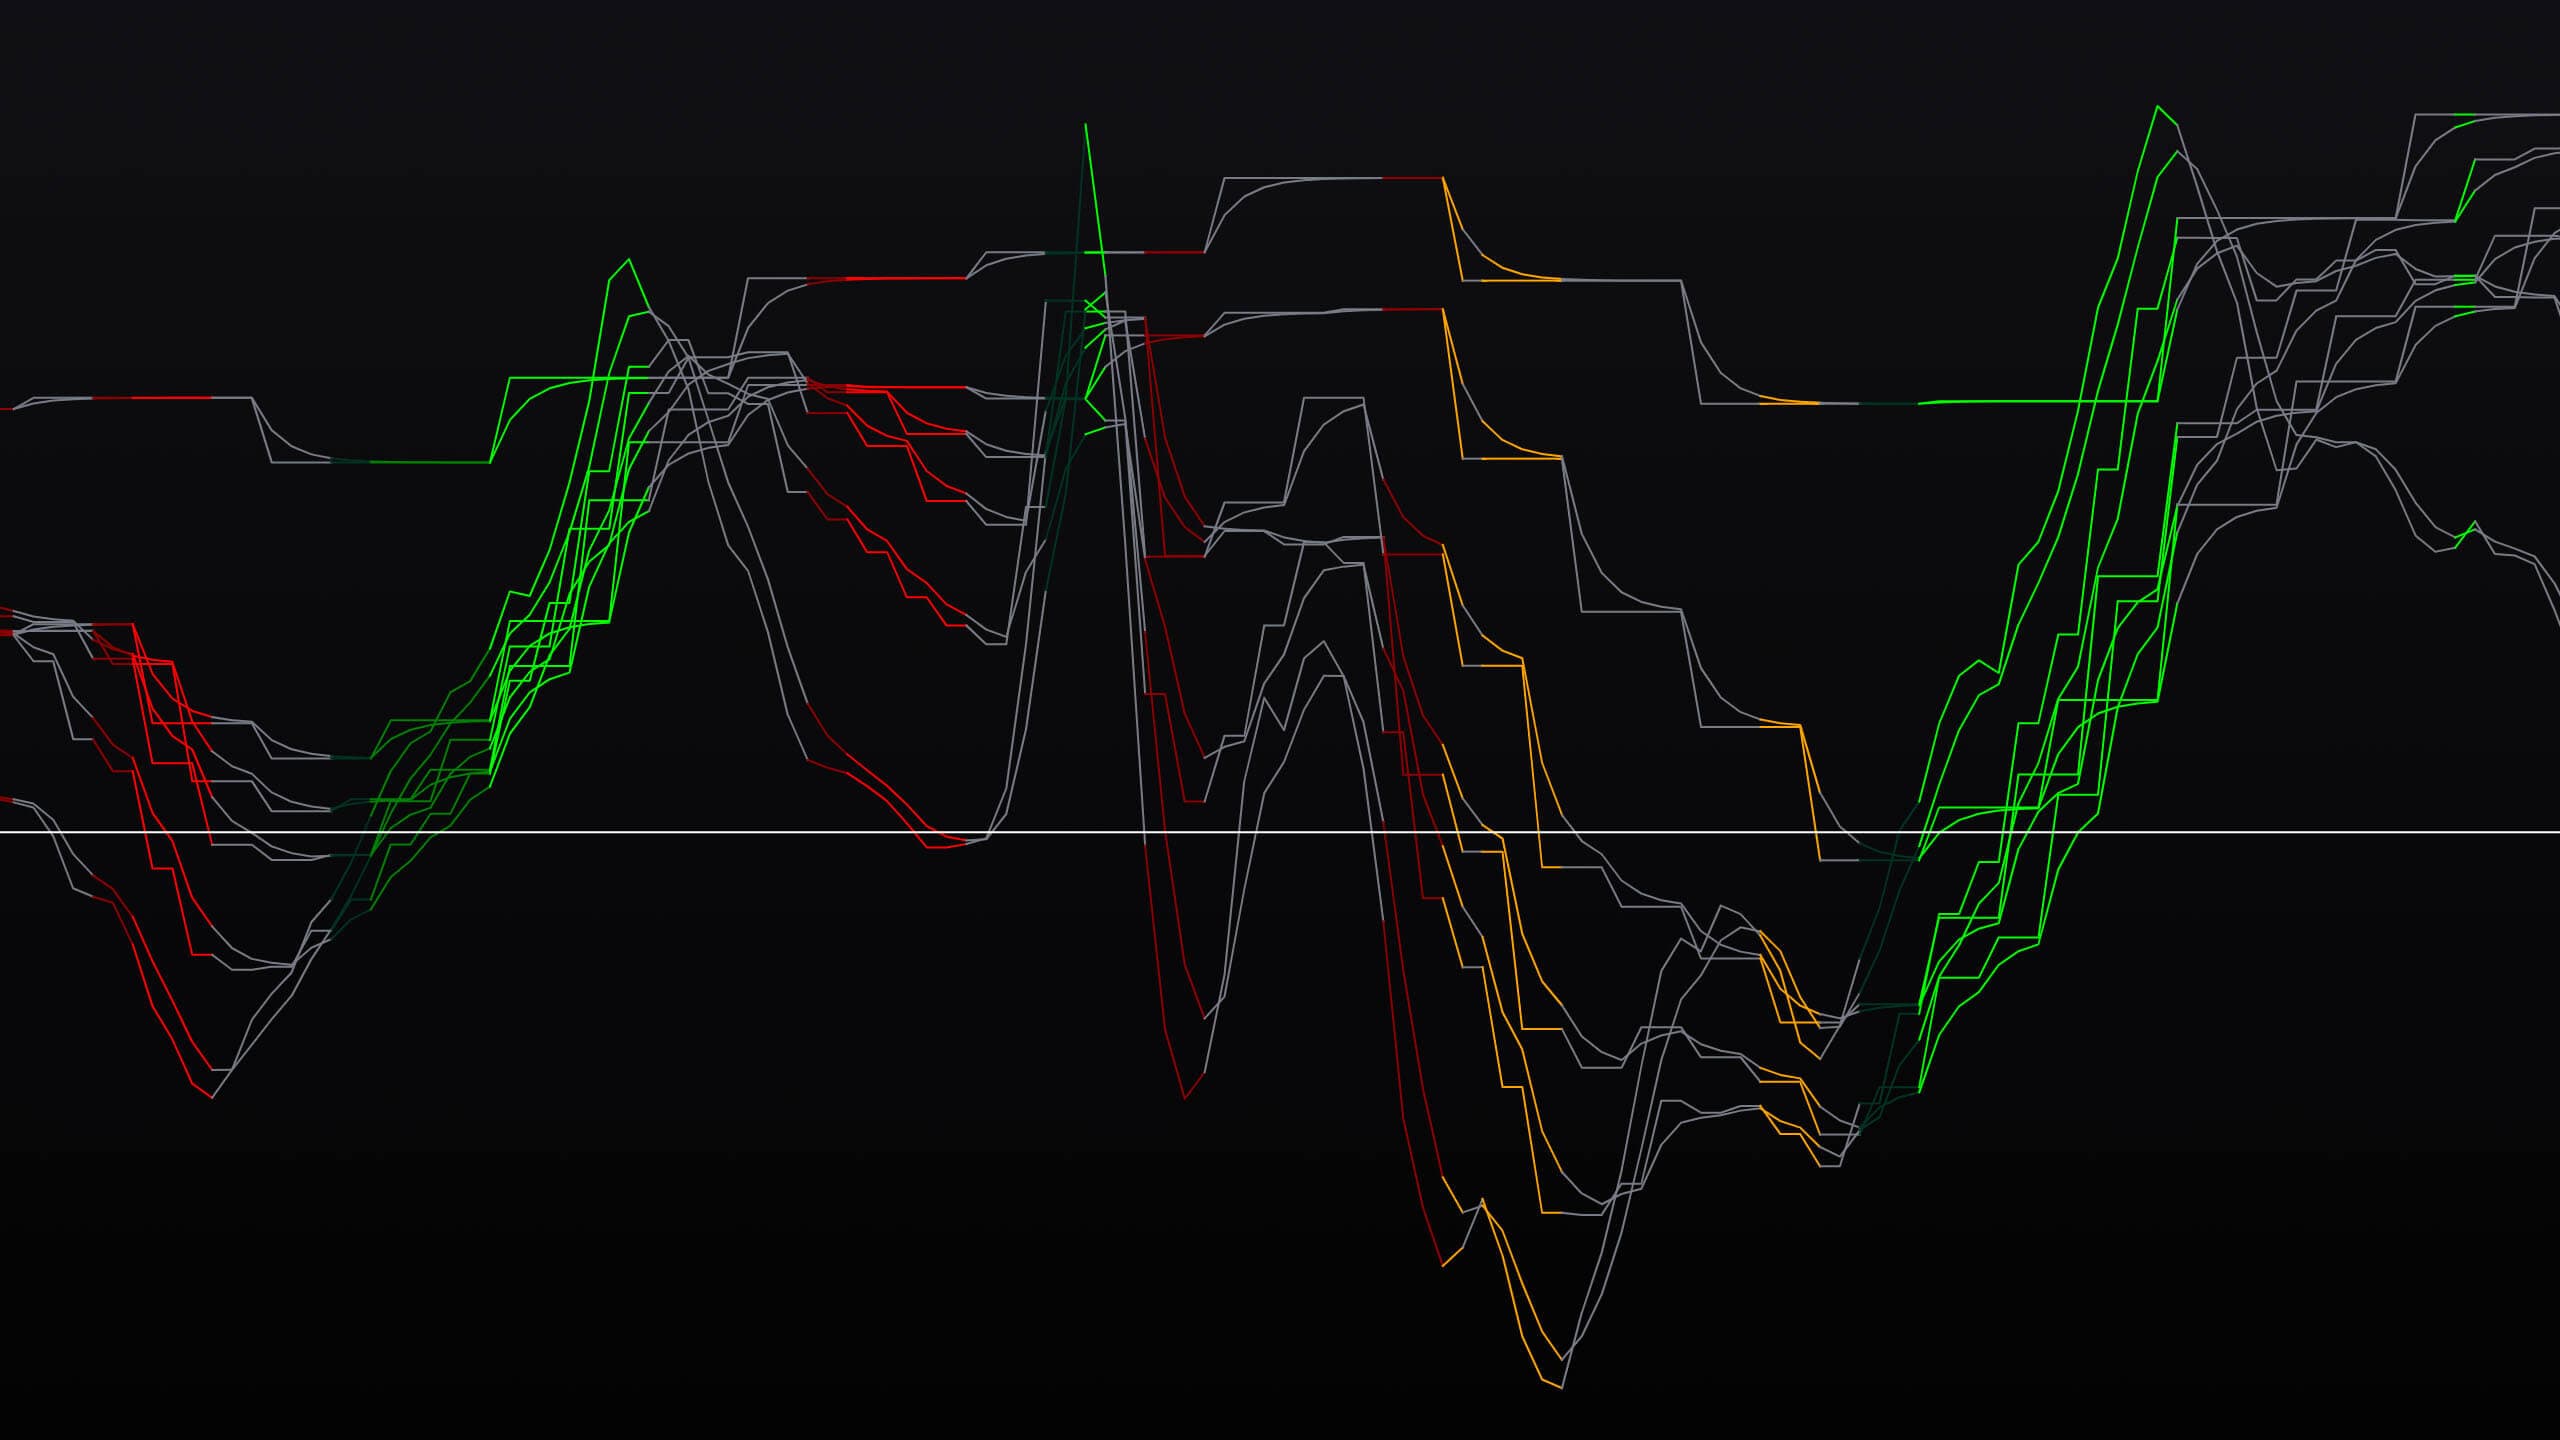
Ghost Vision IV & V: Instant Market Feedback made for Day-Trading
4.9/5, based on 76 reviews
Ghost Vision IV & V: Instant Market Feedback made for Day-Trading
4.7/5, based on 97 reviews
Exclusive tool that we have released in 2023. Made specifically for Day-Trading, It is combining multiple oscillators and EMA lines from different time frames, showing visual indicators of momentum shifts and price action boundaries.
Our Global Traders Say It Best
Callum
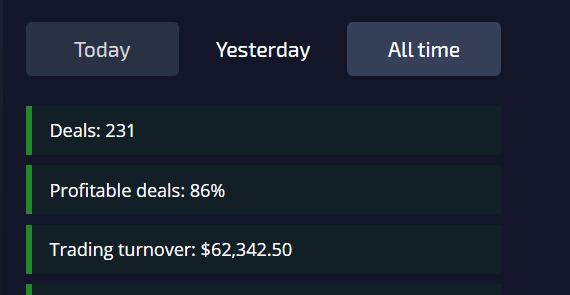
Achieved with non stop practice using ghost vision 1,2 & 3. Above photo is from a live account. Take care.

ThunderStorm
Hello Everyone, I want to express my admiration for GV as the ultimate utility for traders, whether you're new or experienced. I highly appreciate the GV team for making it simple to analyze market trends and make informed decisions that maximize gains or minimize losses. It's definitely the top software to add to your trading arsenal. As a relatively new trader, I've been active for about 1 1/2 months, and without GV, it would be challenging for me to predict market movements. I also appreciate the discord group provided by GV as it offers a great support system for any questions related to the software and being a part of the trading community is a bonus. I am truly grateful to be a part of the GV family. Thank you and God Bless!

Sh4dowehh - llBucksBunnyll
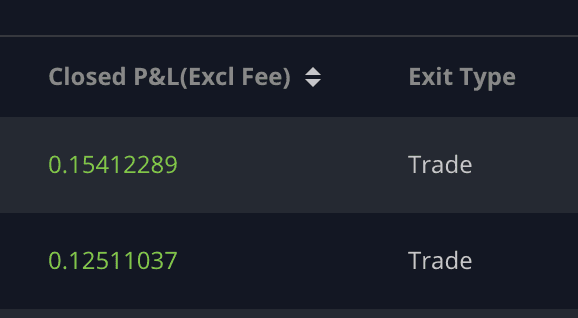
My last two trades after owning ghost vision, still waiting for the full tutorial @Crypto Ghost learning the tool and getting better.

Jamie221
I lost over $1000 trading on my own using different tools both free and paid causing me to have less confidence in my trades I am learning ghost vision and it helps me with establishing strict rules for my trades I was sceptical at first but it starts to kick in now understanding not to trade when the price is away from value and having confirmation from the color columns learning it and slowly getting my confidence back. Thanks Crypto Ghost i will be posting my progress and i hope to be in the green soon :)
Frequently Asked Questions
What is TradingView?


Do I need TradingView?
How to find my TradingView username?
Will this work for me?
What if I’m unhappy with The Indicators?
Trade successfully Now
use Ghost Vision.

Get updates & offers
Learn more about us & get exclusive deals.
Copyright © 2023 Ghost Vision Trading | All Rights Reserved